What the Board Said
We left questions on a whiteboard in the library, and here's how students answered them
Apr 23, 2024
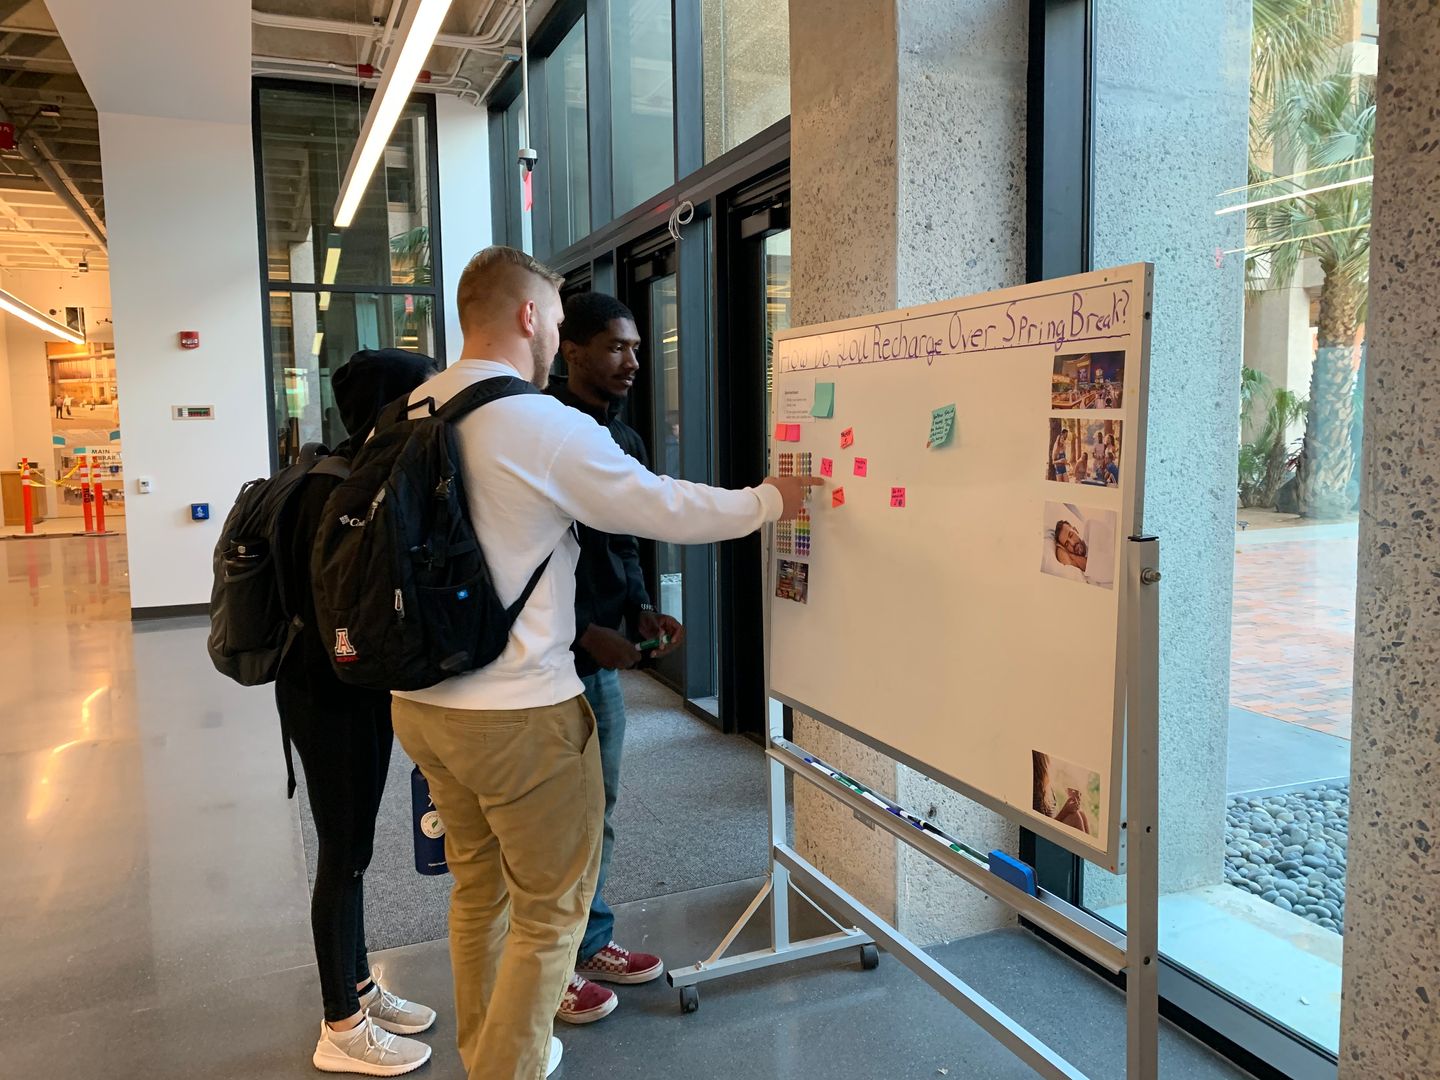
My team at the University of Arizona Libraries uses whiteboards to capture feedback from library users. We leave questions or prompts on the whiteboard and invite library visitors to respond with sticky notes. We call them “talk-back boards.”
Talk-back boards are often displayed in museums or libraries to capture free-form feedback as a part of visitor study projects. Museums also use them for interactive programs where visitors can participate.
We set up the first talk-back board at our library in 2018. Over the years, more than 40 boards were displayed with topics including website feedback, book recommendations, space evaluation, and creative projects. We captured responses for 37 boards in the library’s UX Research Repo.
Here’s a recap of four of my favorite talk-back boards.
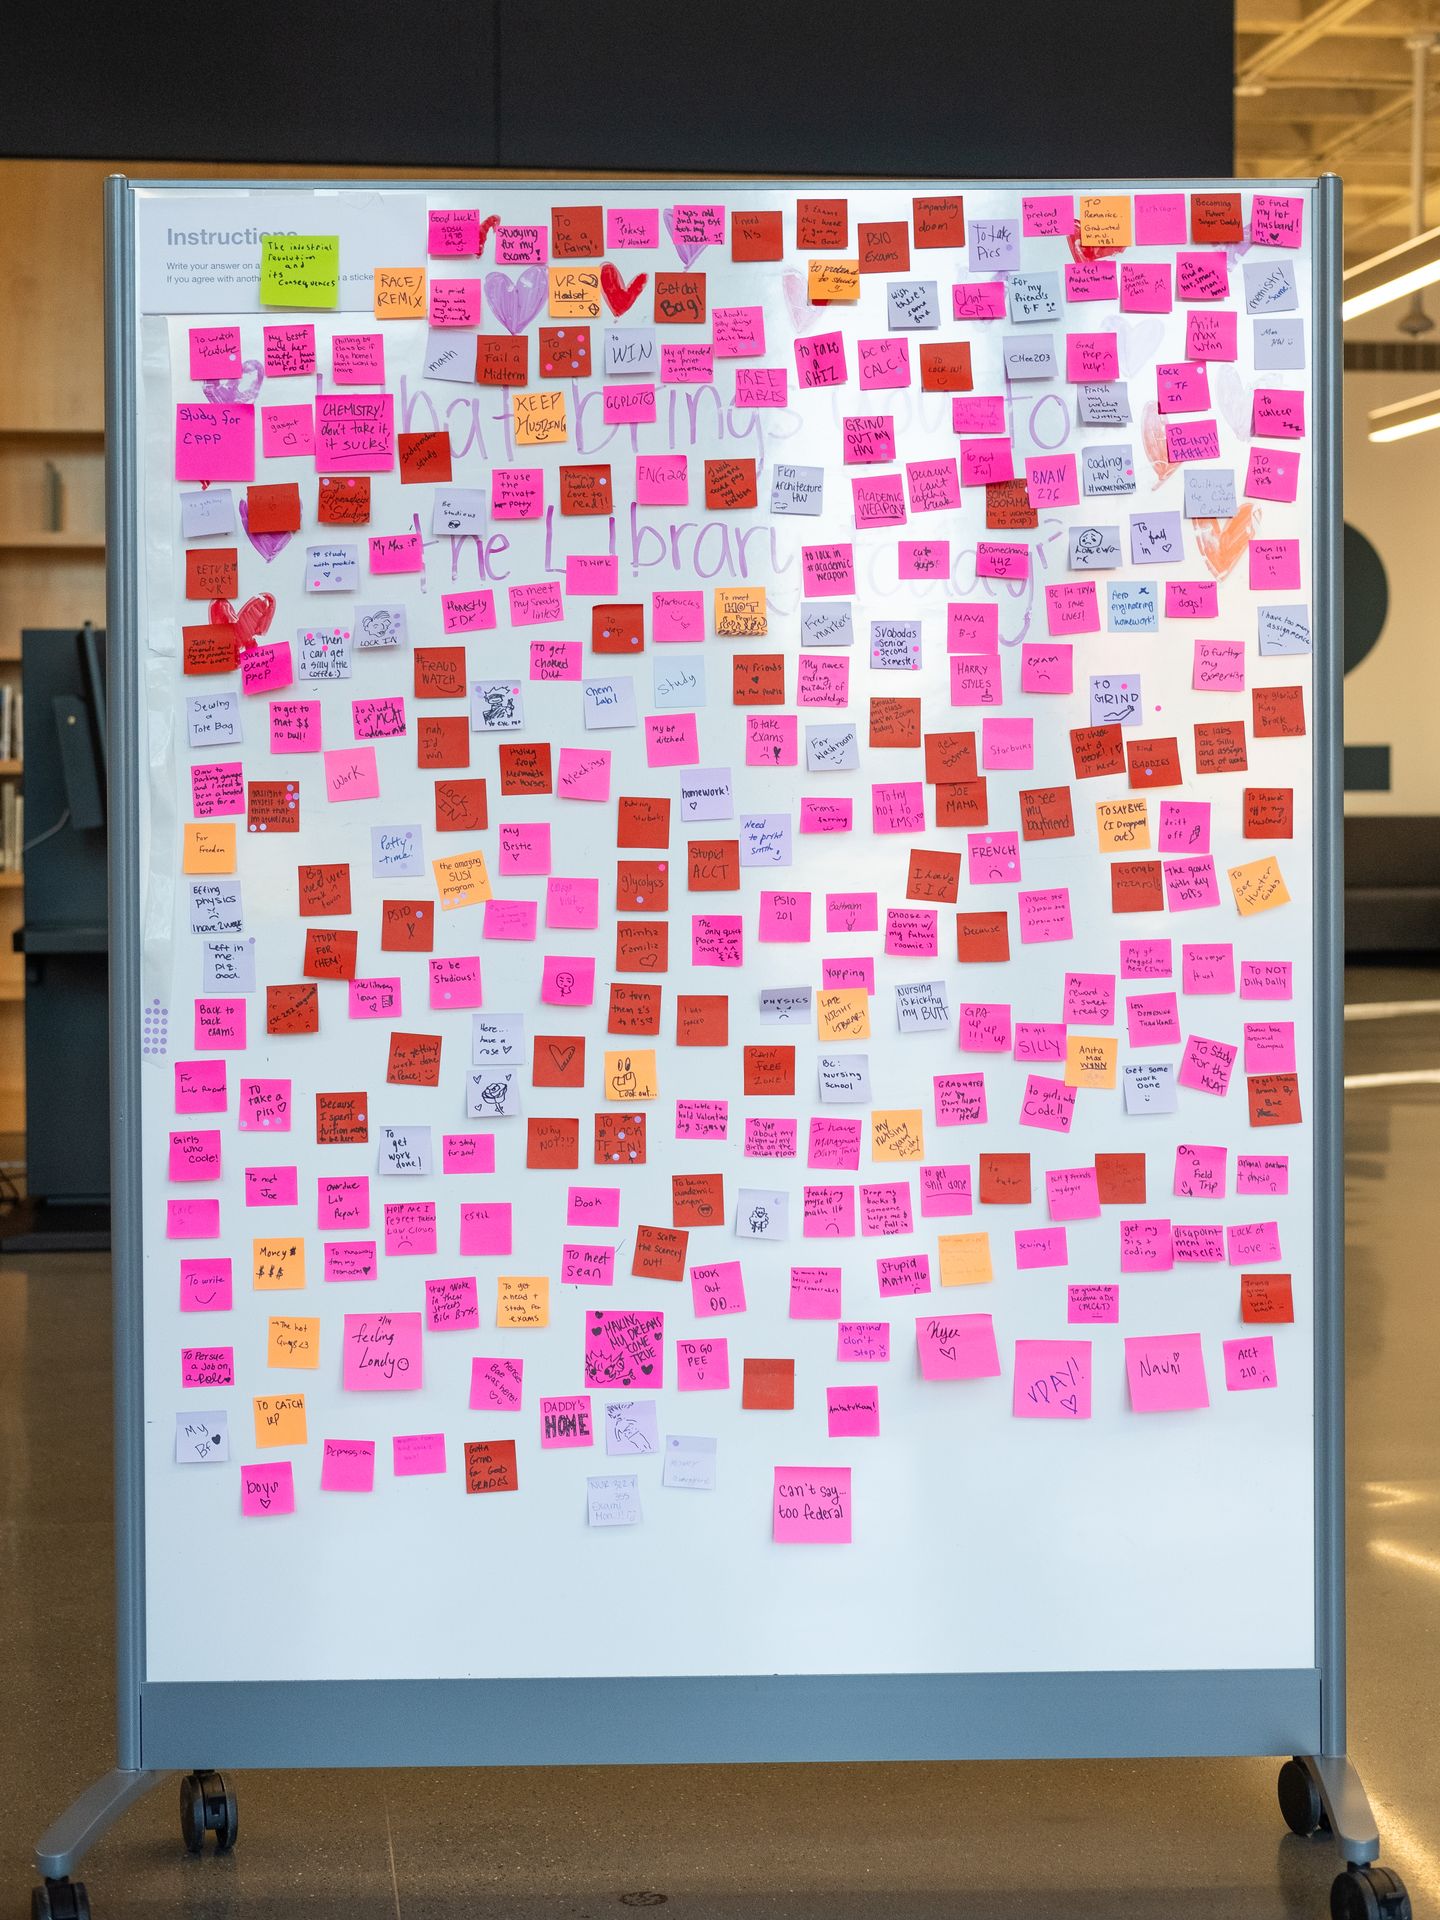
February 2024: “What brings you to the library today?”
Our team want to know what motivates people to visit the library in person, so we often post the same question in different library locations. This board was set up during the week of Valentine’s Day in 2024, and we prepared pink, orange, and red sticky notes to celebrate.
In the instructions on the board, we asked the participants to add new answer with a sticky note and vote on existing answers with a smaller sticker. The same instructions were included for most talk-back boards we set up.
Answers that received more than 3 votes:
- “gaslight myself to think that I’m studious” (+6)
- “bc then I can get a silly little coffee :)” (+5)
- “To cry” (+5)
- “TO LOCK TF IN!” (+4)
- “To be Studious” (+3)
- “To take a piss” (+3)
- “coding HW :( WOMENINSTEM” (+3)
327 sticky notes were captured in 8 days. We analyzed each answer and extracted the following themes:
- Studying/working (100 responses)
- Relationship (37 responses)
- Restroom (11 responses)
- Library technology (8 responses)
- Borrowing/returning books (7 responses)
- Buying coffee (7 responses)
- View/scenery (6 responses)
- Bad weather (4 responses)
- Reminiscence (4 responses)
In addition to the common reasons of visiting the library such as studying or using the restroom, we were glad to see answers mentioning library technology as a result of the Libraries’ revamped and expanded tech lending program. Interestingly, the Valentine’s color scheme may have led the answers in a certain way, which is why “relationship” became the second most popular theme.
Our student assistant, Linda Lopez, also asked ChatGPT to analyze the answers. When doing so, she found that it could not recognize terms like “lock in” and “grind” as Gen Z slang for studying. She then manually edited some of the data before running the analysis in ChatGPT again, and here are the themes she got:
- Study purposes
- Specific academic work
- Personal activities
- Specific tasks
- Humor
- Interpersonal connections
- Emotional state
- Physical needs
- Miscellaneous
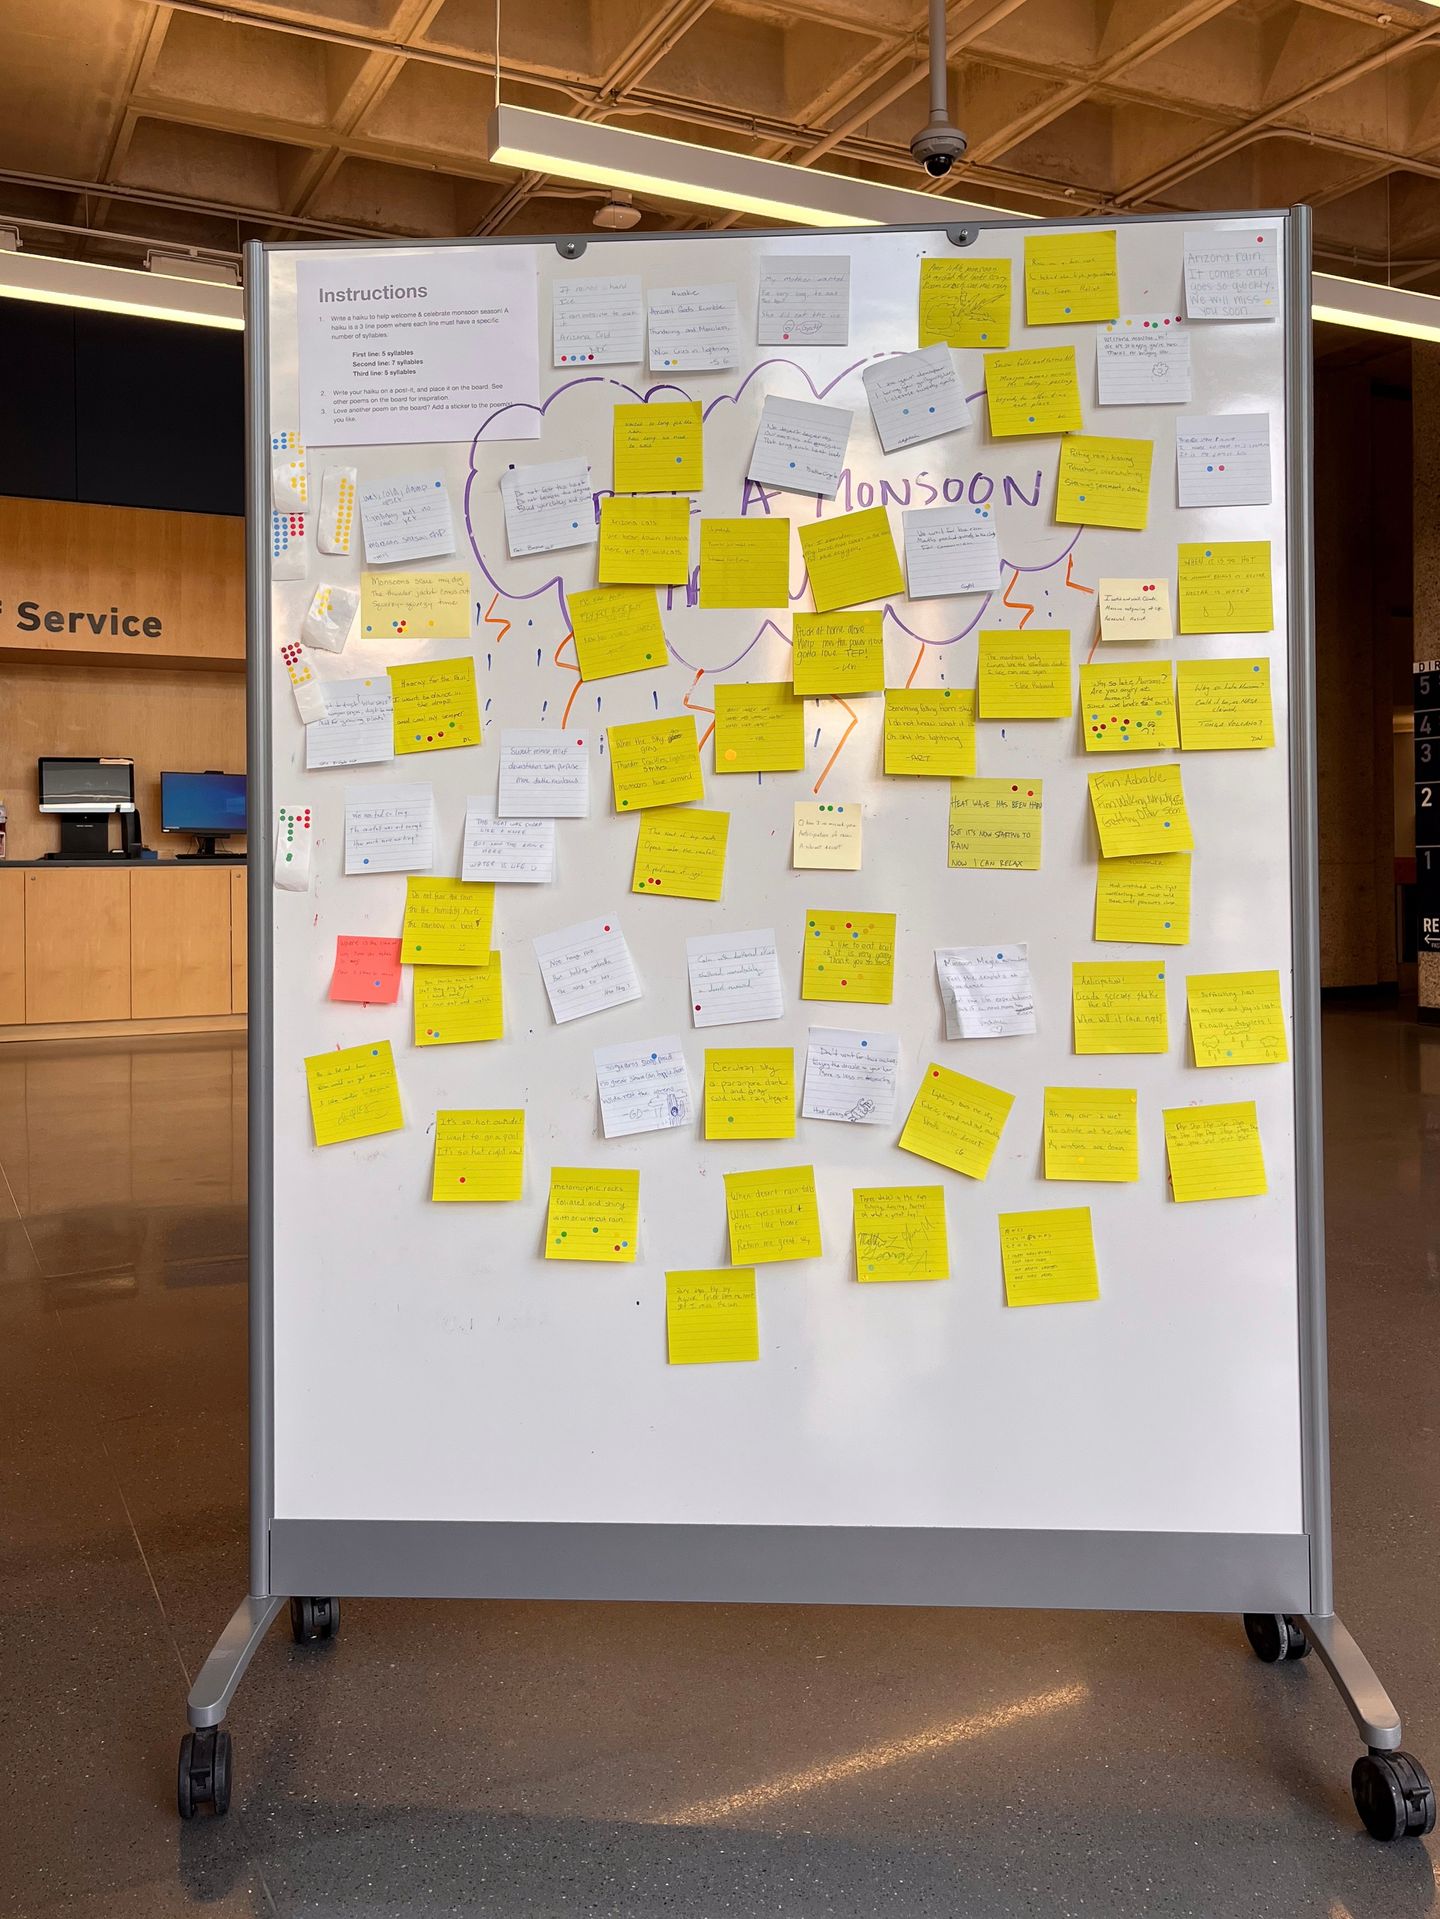
August 2023: “Write a monsoon haiku!”
In June and July, people in Tucson anxiously wait for the monsoon rains to bring the cure for the unbearable Arizona heat. That’s also the time of the year when we set up this recurring creative project where library visitors are invited to write a haiku, which are 3-line poems in the following format:
- First line: 5 syllables
- Second line: 7 syllables
- Third line: 5 syllables
Here are four most popular haikus of the 2023 monsoon season:
11 votes:
I like to eat hail
oh it is very yomy
Thank you so much
10 votes:
Why so late Monsoon?
Are you angry at humans
Since we broke the earth?
7 votes:
Welcome monsoon, hi!
We are so happy you’re here.
Thanks for bringing life.
7 votes:
metamorphic rocks
foliated and shiny
with or without rain
When capturing answers on this board, our friend Kevin O’Dea, Platforms Engineer at the Libraries, helped us develop a workflow to quickly transcribe text from photos. He created a Photoshop script that detects sticky notes, crops them out, and exports them to individual images. He then used OCR tools to extract text from the images.
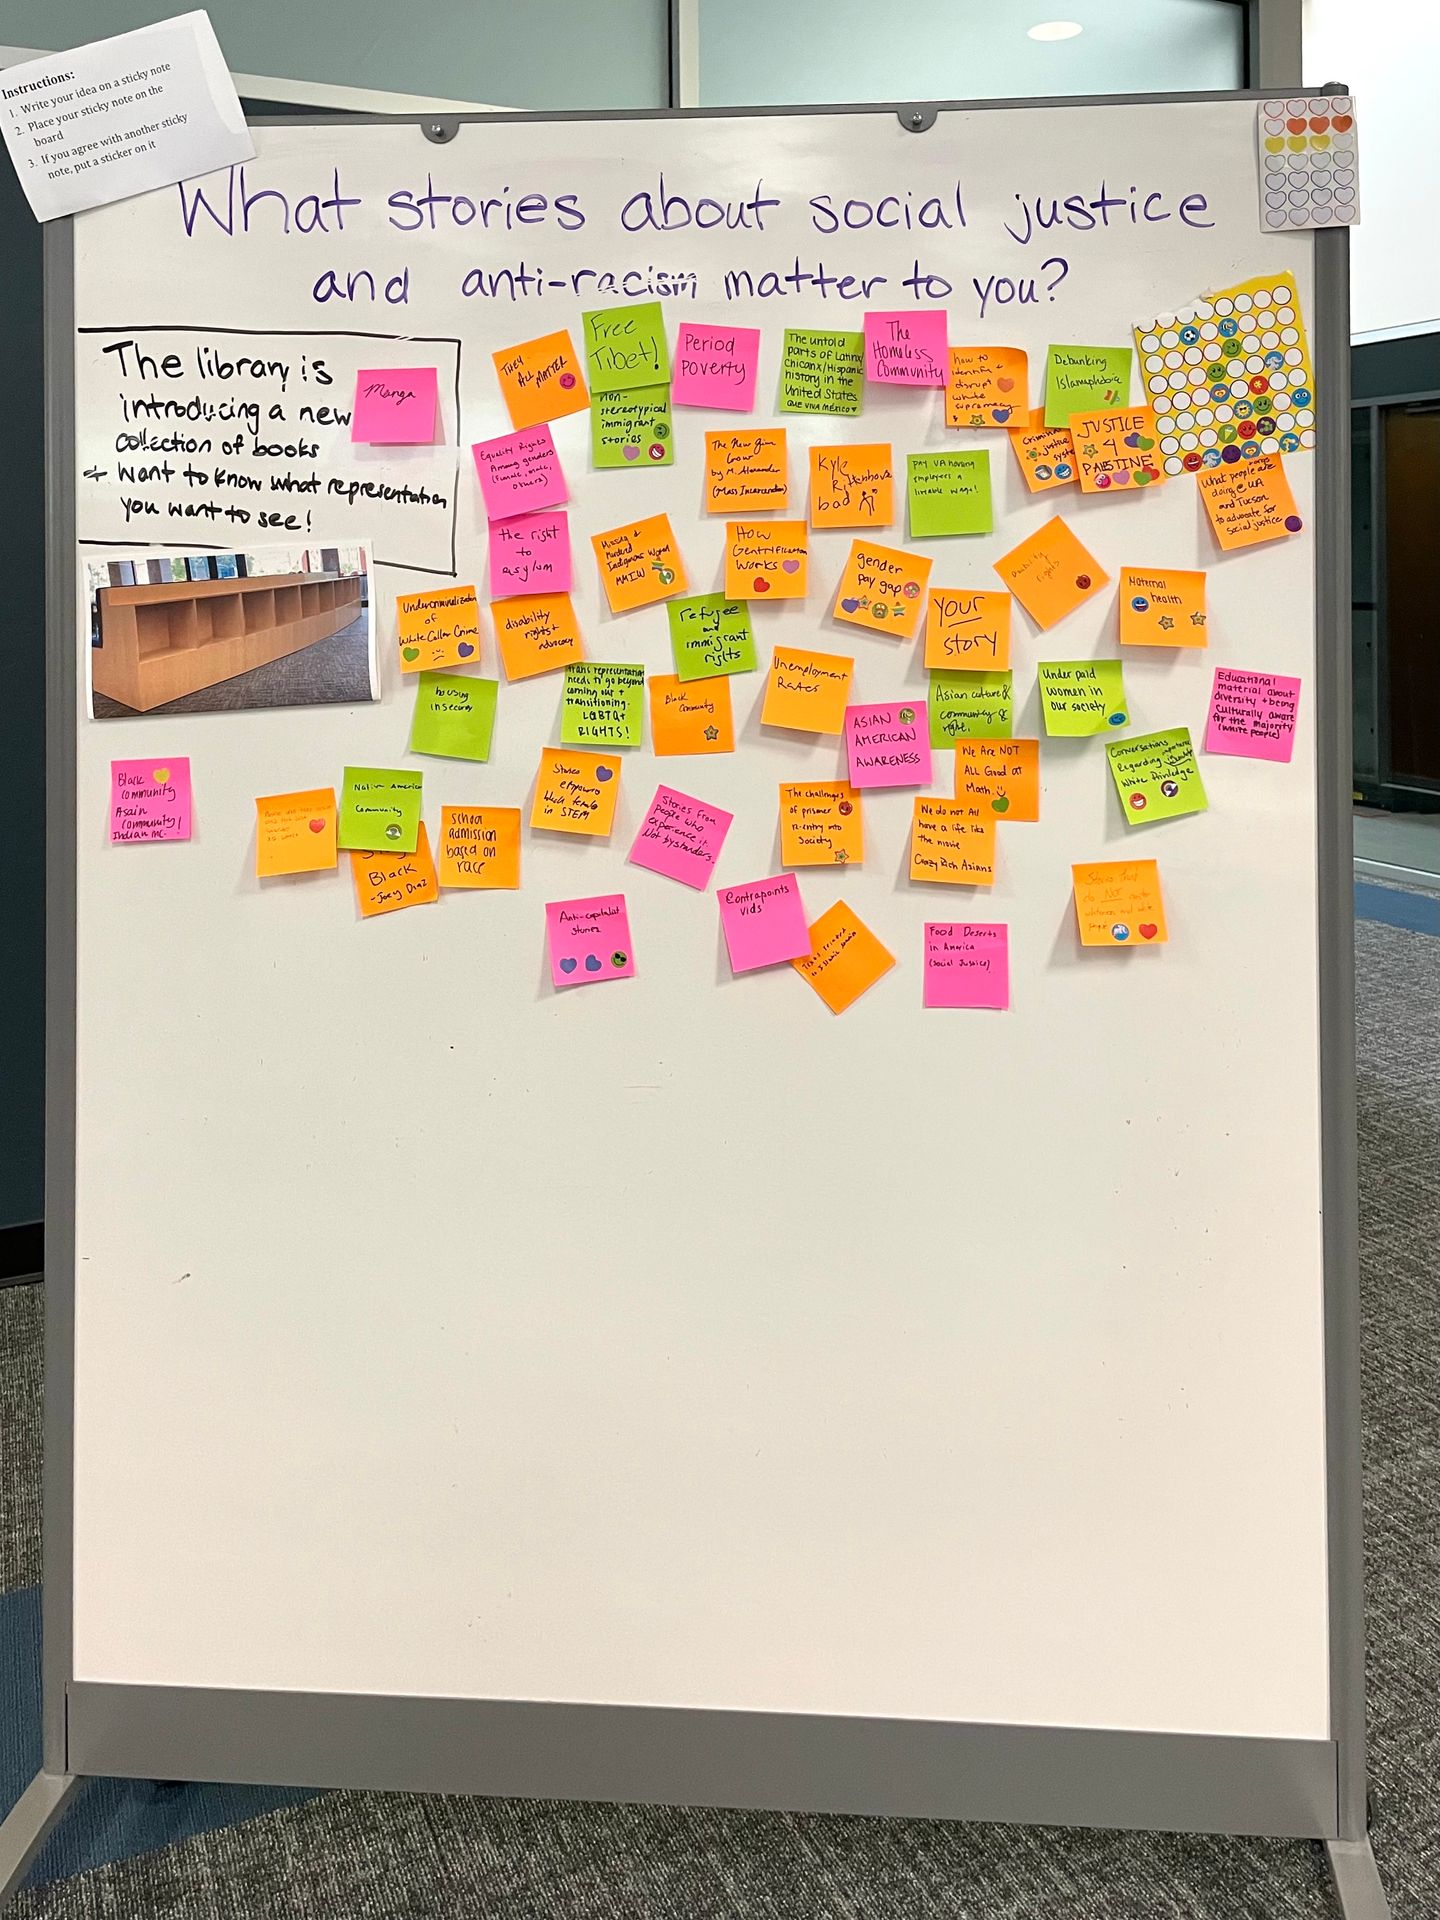
December 2021: “What stories about social justice and anti-racism matter to you?”
In 2021, the Main Library unveiled the new Books that Matter collection that focuses on social justice and anti-racism. We set up this board to learn what books students think should be added to this collection.
Here are seven answers with the most votes:
- “JUSTICE 4 PALESTINE” (+7)
- “gender pay gap” (+5)
- “criminal justice system” (+4)
- “how to identify & disrupt white supremacy” (+3)
- “non-stereotypical immigrant stories” (+3)
- “Maternal health” (+3)
- “Anti-capitalist stories” (+3)
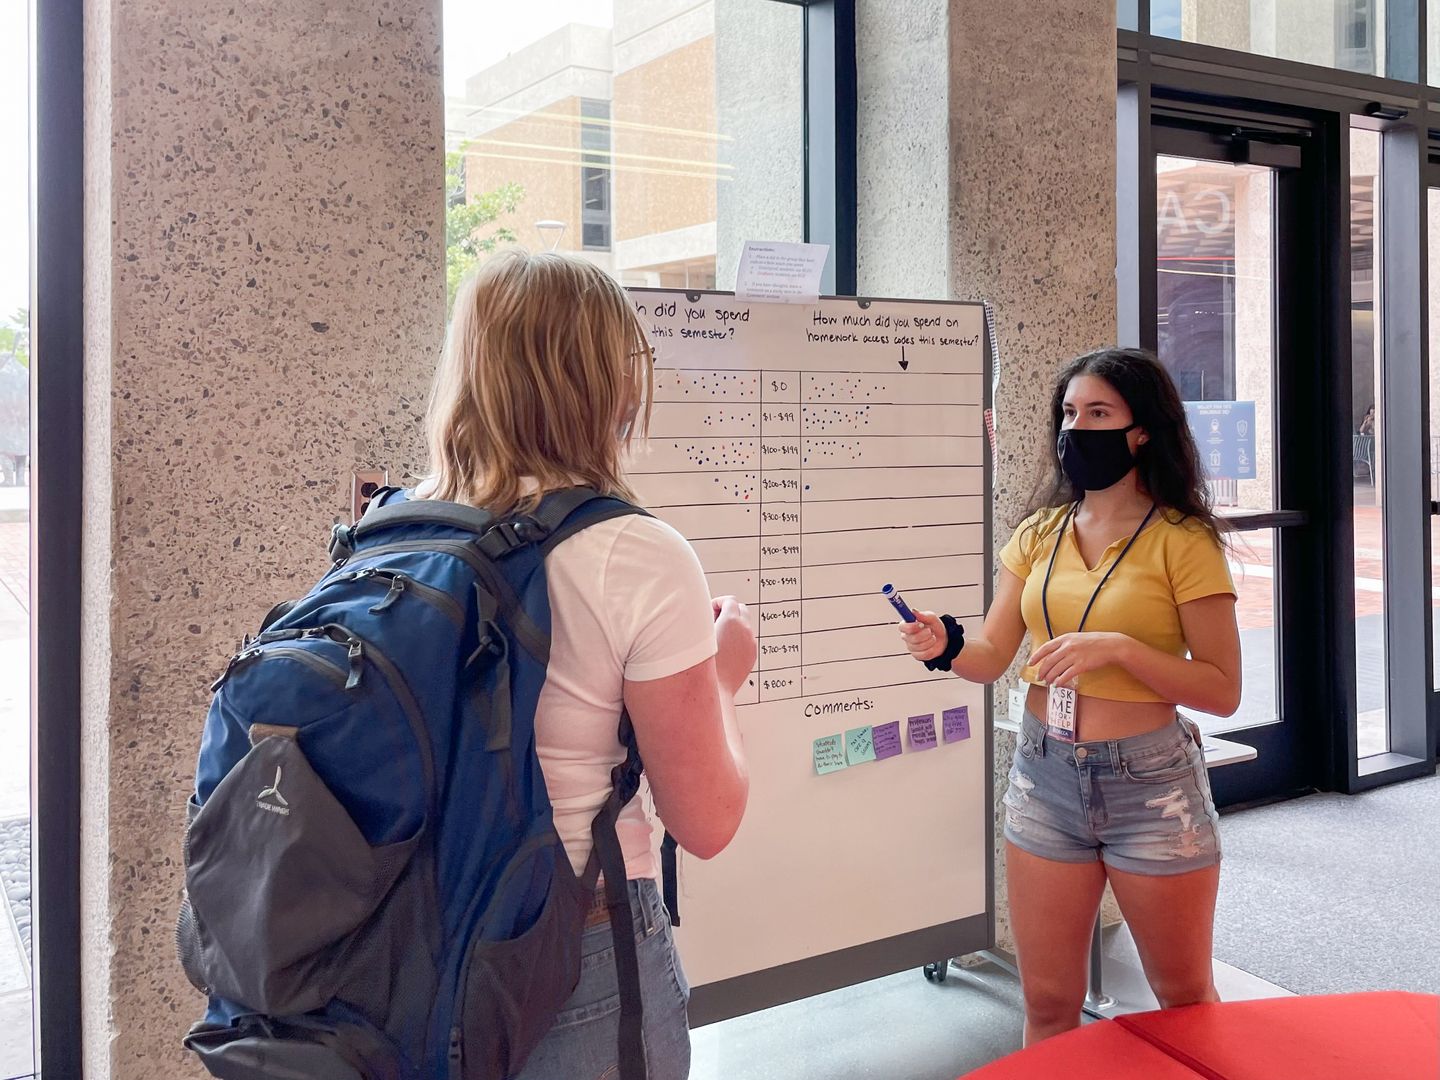
September 2021: “How much did you spend on textbooks & homework access codes this semester?”
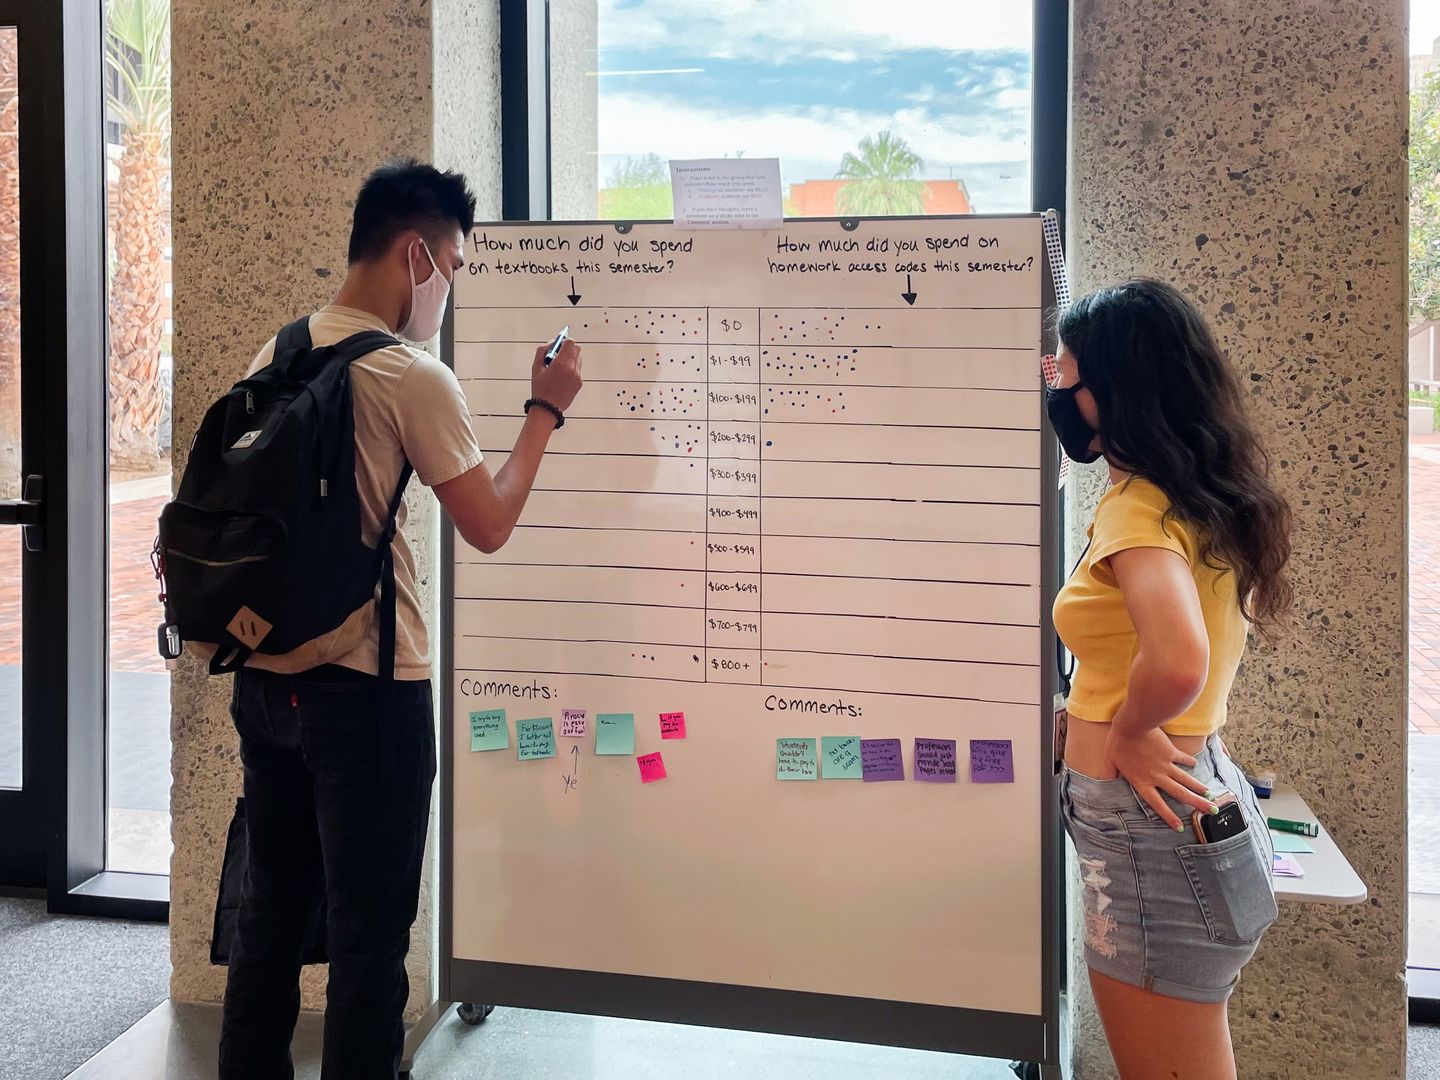
In 2021, our library was ready to implement a flat-fee textbook program introduced by the university’s book store. Two librarians who led the project wanted to learn how much students spent on textbooks and homework access codes prior to this program.
Our student assistant Riley Zuckert, who has a background in data science, designed a talk-back board that visualizes data. She set up the board with two questions:
- How much did you spend on textbooks this semester?
- How much did you spend on homework access codes this semester?
Under each question, she included a vertical axis to represent cost ranges from $0 to $800+. She then invited students to mark their numbers on the axis.
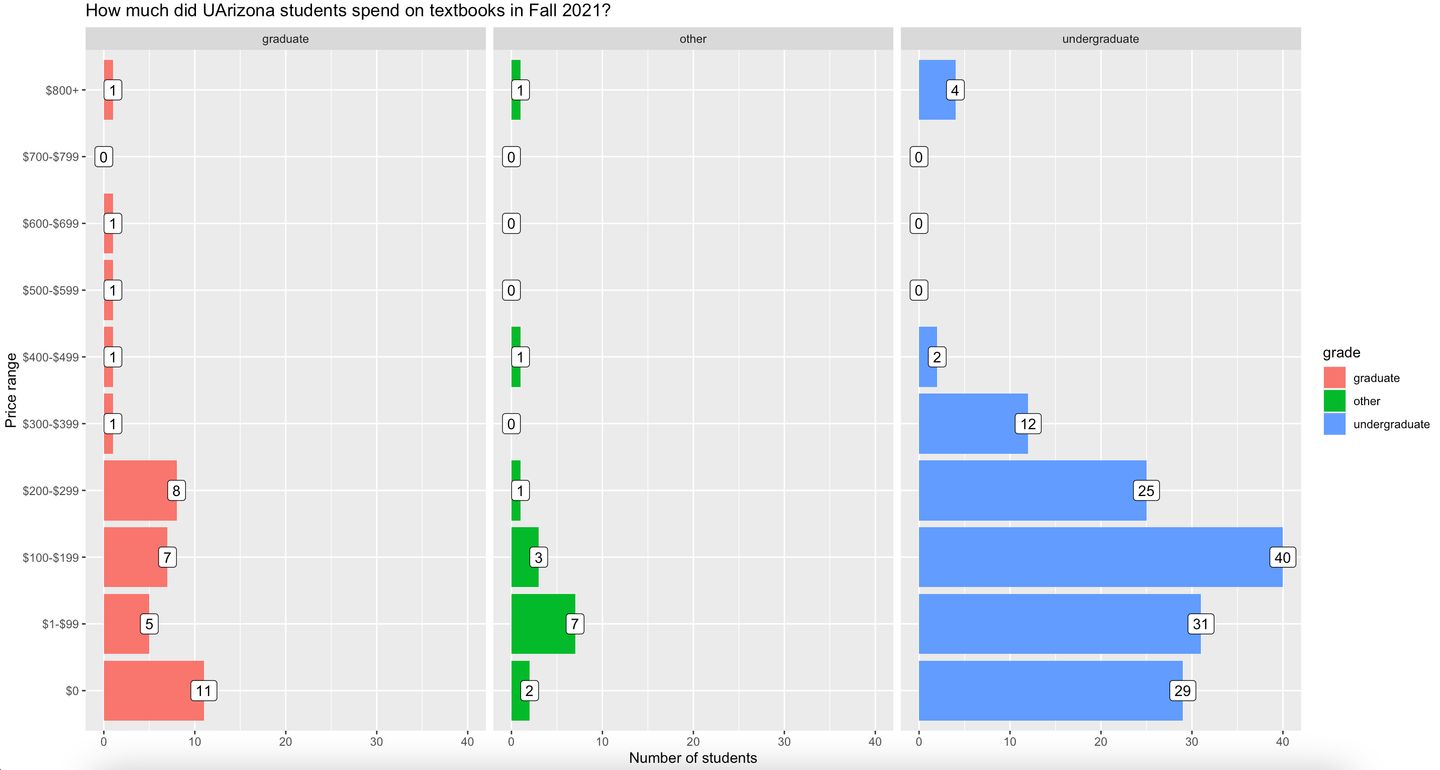
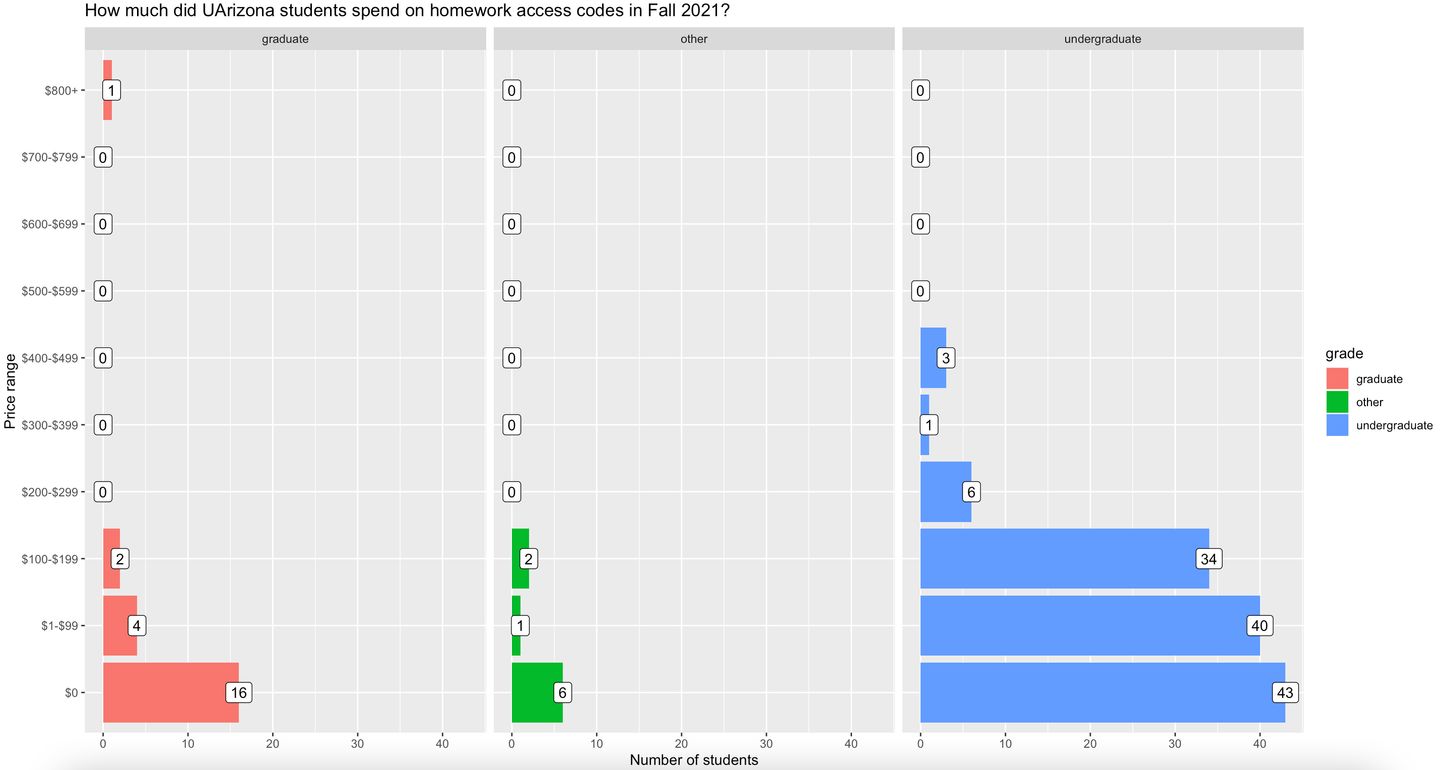
The board collected 308 answers over two weeks. We then calculated the percentages based on the answers:
How much did you spend on textbooks this semester? (Based on 170 answers)
- $0: 22.35%
- $1-$99: 21.18%
- $100-$199: 27.06%
- $200-$299: 15.29%
- $300-$399: 7.06%
- $400-$499: 2.35%
- $500-$599: 0.59%
- $600-$699: 0.59%
- $700-$799: 0%
- $800+: 3.53%
How much did you spend on homework access codes this semester? (Based on 138 answers)
- $0: 36.23%
- $1-$99: 30.43%
- $100-$199: 20.09%
- $200-$299: 4.35%
- $300-$399: 0.72%
- $400-$499: 2.17%
- $500-$599: 0%
- $600-$699: 0%
- $700-$799: 0%
- $800+: 0.72%
In the meantime, Lauren Dunn, intern on our team, ran a survey with the same questions on Instagram and collected 20 more answers. Riley then combined the data from the talk-back board and Instagram to created the following histograms to visualize the answers:
Takeaways
The talk-back board has become an essential piece in our UX research toolkit for collecting unmoderated user feedback for websites, services, and spaces. It’s also perfect for engaging library visitors through creative projects that help them de-stress with fun distraction.
As we experimented with a wide spectrum of topics, we developed handy workflows to transcribe written answers to text for analysis. We also learned how to use AI tools for the initial analysis such as identifying common themes.
Since the boards were mostly left unattended in a public space, we inevitably saw inappropriate responses. Our team members as well as the Libraries’ desk staff regularly checked the board to remove those responses. We also refilled the supplies as needed.
Want to read more?
You can browse more of our talk-back boards in the Libraries’ UX Research Repo.
